I have referenced more than my fair share of charts, graphs, trichome pictures, ec data, vpd data, and many more during this past grow. I thought it would be a great idea to post this data in one discreet location. I apologize in advance if someone has already done this. If so, I’ll delete the thread. Feel free to post any images that might help with growing cannabis. Some will be self explanatory. Feel free to give an explanation.
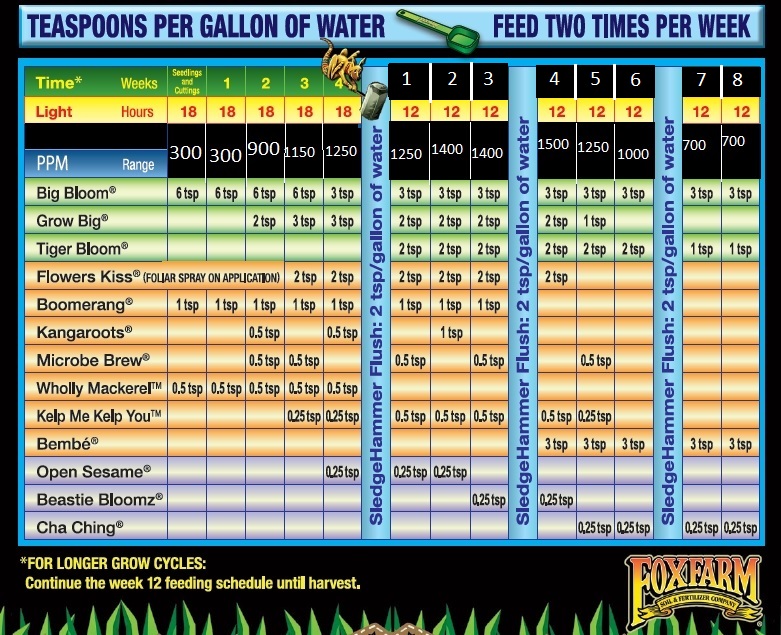
Below is a chart for anyone using FF nutrients running a Hanna 500 ppm meter, as FF uses ppm 700 for their feeding schedule. This is a common problem when using FF nutrients. Most people are using Hanna meters, because most tds meters sold on Amazon are Hanna 500 ppm meters. Credits for the below image go to @BobbyDigital
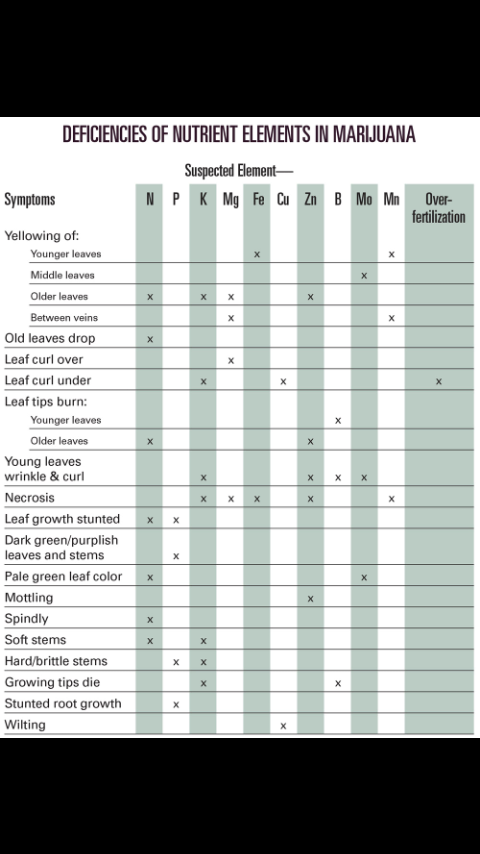
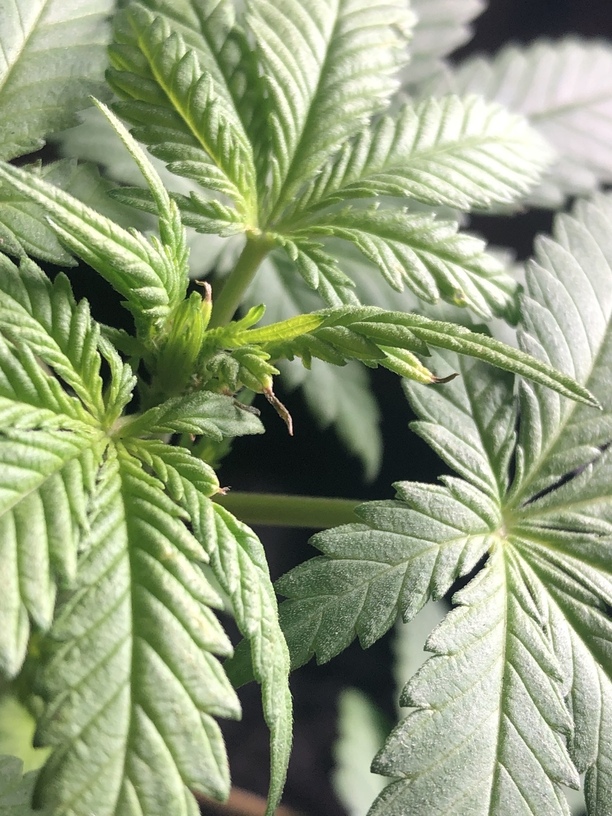
Always try to upload a clear picture of any issues you may have to allow the community to assist you.
Add anything else you feel would help us give you a most informed answer should be included. Feel free to elaborate, but short and to the point questions and facts will help us help you in a more efficient manner
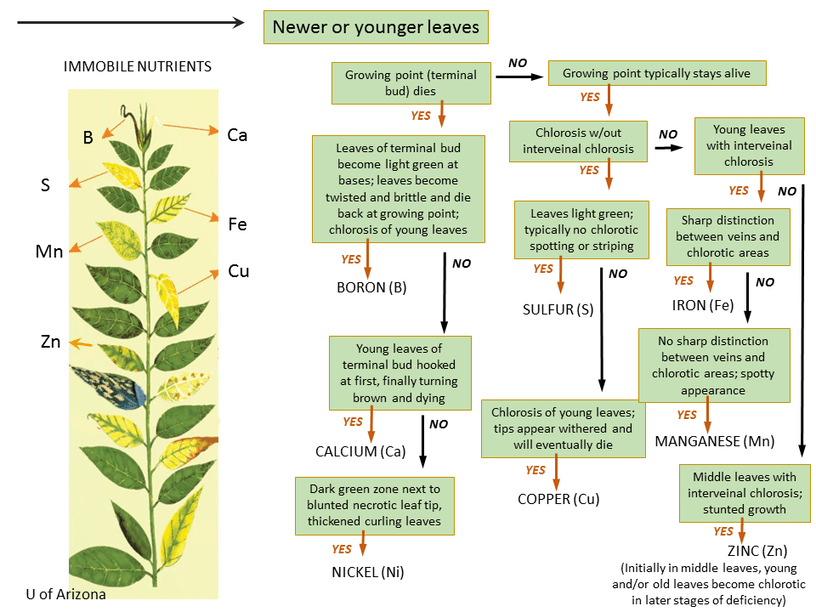
That’s great! Thanks. As @MacGyverStoner pointed out in that thread, images aren’t always correct, and some can be misleading when originating from different sources. I guess we should be careful about what info is posted.